
Multi-way tables for the Storage of Summary Data
Introduction ¦ Motivation ¦ Structure ¦ Manipulation ¦ Presentation ¦ Conclusions
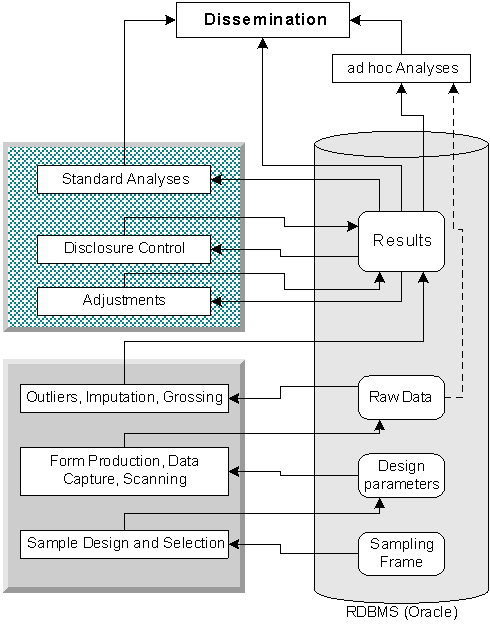
Demand for statistical products is increasing, and producers need to find new ways for operating the production process and meeting customer requirements. Particular problems apply to large, recurrent surveys such as those often run by National Statistical Offices (NSOs). Clients (whether other departments or external, paying customers) often complain about delays in the production of paper series, and about the inflexibility of the published information.
One approach is to base the whole production process (after the capture and cleaning of raw data) on a database of aggregated data, in which the maximum amount of detail is retained. In particular, standard classifications (such as product type, or area, or time period) would be retained with the maximum amount of detail consistent with statistical reliability, and only grouped into broader categories when used. It is essential that the database has a formally defined structure and is supported by properly structured meta-data.
A small group of academic researchers from computing science have been looking at statistical database issues for some time. A significant contribution is the STORM proposal from Rafanelli and Shoshani, which offers a formal model for aggregated data. Essentially this model views aggregated data as a multi-dimensional structure of classifications, where each cell contains a number of summary measures. Each dimension can have a classification structure for regrouping (from detailed to broad groups), and each measure must have an aggregation process defined. Other details relating to the underlying population and the selection rules are important. Later work by Lenz and Shoshani has looked at different classes of summary measure and the rules for summarising across categories.
Much work has also been done by the commercial database community, in the context of data warehousing and OLAP (Online Analytical Processing) analysis. Similar structures have been developed (often called Data Cubes), but without as much attention to the statistical requirements. A few specialised statistical products have been developed, with more focussed statistical facilities.
Starting from this base the general statistical service can be improved by:
This paper reviews the situation relating to the production and publication of large
volumes of statistical information, such as produced by National Statistical Offices
(NSOs). We review both academic and commercial developments, with a view to improving the
accessibility and use of data from large or continuous surveys and inquiries. These are
characterised as having a significant volume of data processing and output, often with
complex processing to produce representative and comparable figures, but not great depth
of analysis. Production will generally be in the form of large amounts of classified
summary data, and analysis will be in the form of comment on trends perceived in headline
summary figures. Some clients will extract small volumes of data of specific interest,
while others will want to perform more detailed analysis. We assume that the volume of
data is sufficient for some form of disclosure control to be feasible.
We are looking for an approach to be applied after initial data entry and cleaning, which provides support for:
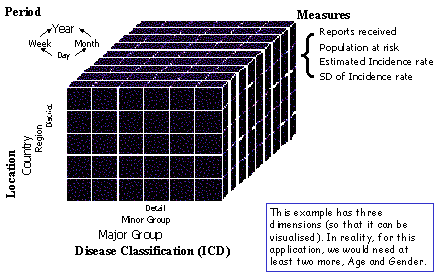
The data structure for storing summary information is a multi-way table, a hypercube with multiple dimensions and with cells containing multiple values. Each dimension is a classification structure, with consolidation from detail to broad groups through various levels of aggregation in a hierarchical tree. Each cell of the table contains multiple measures, the same in all cells, which can be counts, sums, means, or other expressions.

Formal academic work on this structure has been underway in the statistical database field from at least the early 1980’s, and is found particularly in the SSDBM conferences, with work by Rafanelli and Shoshani on the STORM model being central. An alternative, more commercial, thread can be traced from work by Codd, who coined the term OLAP, and has resulted in various tools, from database vendors (Oracle, Ingress, MS SQL Server) and specialist firms, generally referring to Data Warehousing, or Data Cubes. This work is based on more traditional computer science views of databases, and does not give much attention to the specific requirements of statistics, such as validity rules or contextual meta-data. Some special statistical products also exist, such as PC-Axis, SuperCross and Beyond 20/20.
The formal analysis of the nature and properties of the structure allows for the formulation of precise rules for the specification of the structure, plus derivation of the consequential properties and behaviour. For example, clear rules are needed for identifying the underlying population elements that are described by a table, for ensuring that classification categories are exclusive, and for identifying different types of summary measure. This then leads to rules for computing aggregations of measures (for margins and consolidation) and for deriving additional measures (such as rates).
A multi-way table is a dynamic structure, in that the view that a user wants may contain much less detail than the underlying table. This is similar to the idea of a View in a relational database. To support these views, and to allow a user to change a view in order to seek required information in a table, various forms of manipulation functionality are required.
Selection, as in a RDBMS, is the operation to extract subsets of classifications and measures. There is also a need to reduce or increase detail in a classification, for example, moving from detailed to broad groups on a dimension, or showing the next level of detail for a particular group. These operations are called Roll-up and Drill-down in OLAP. Note that this includes extraction of margins.
The derivation of additional measures and classifications requires manipulation functionality, but also should involve rules (or at least advice) about the validity of the operation and the nature of any derived measure. For example, dividing a sum by a count will produce a mean, provided that the two components are based on the same selection of elements, and dividing one count by another will produce a proportion, if the numerator count is a subset of the denominator. Important work on identifying rules for valid derivations has been done by Lenz and Shoshani. New groupings may be needed within classifications, and measure derivations can operate within and across classifications, as well as within cells. Derivations between tables are also possible – this leads to conformability rules.
The formality of structure and functionality with this model for summary data means that automation can be envisaged. An object model (consisting of structures, properties and methods) can be defined, and implemented as a set of programming objects with a suitable API (programming interface). This then provides the basis for application developers to implement specific tasks, or for the development of general purpose packages. Tools of this type are already appearing (such as Beyond 20/20, SuperCross, PC-Axis, and the OLAP products) – indeed, some have been around for some time in previous incarnations.
An important aspect of this approach to summary information is the separation of the internal, logical structure of the data from the external layout required for presentation. However, functionality is required to support presentation, whether on screen, on paper, or in some other form. This must support mapping from logical structure to presentation layout, that is the specification of rows, columns and pages, including the combination of separate tables (in appropriate ways). When used in a browsing context the functionality should be dynamic, allowing the user to explore the data, as described previously. The ‘Pivot Table’ component of MS Office 2000 provides a good initial model for this, and Beyond 20/20 is more statistically oriented, though a little less flexible.
For dissemination it must be possible to generate different types of output, and with different packaging. While the full detail tables will be retained for internal use, exported tables will generally have less detail, so views will be turned into real tables. It is essential that disclosure control can be applied to exported tables, and to all other released material. Statistical reliability can be addressed by including appropriate measures (with update rules) in the tables.
For publication on paper, MS Office (or similar) products provide a good environment for generating reports and analyses (including automation options). Publication of static pages on the web is essentially the same problem but with different output formats and better navigation options, and, again, recent office products are addressing this issue. However, the web will also need dynamic versions, for exploration. Initial examples are provided by the ONS Statbase service, and the Beyond 20/20 web server.
Users who need machine readable output should be able to export or download information. Spreadsheets provide a suitable form for simple cases, but full multi-way tables will be needed for in-depth analysis, which implies the availability of manipulation or browsing software for the user. Dissemination on CD addresses problems of scale and direct web access, but can simply reproduce the web content, providing static, dynamic and extract facilities through a browser.
Now is a good time to be addressing the problems of working with summary information. Consolidation is needed on the academic work, bringing the various strands together, filling in gaps and extending concepts, and increasing awareness outside the statistical database community.
The emerging OLAP tools are a useful solution in simple cases, where data volumes are large, but neither design nor analysis is complex . Prices have been expensive, but are falling: for example, OLAP tools are now integrated into MS SQL Server, and the MS Excel 2000 Pivot Table is a useful exploratory browser. Some useful specialist statistical tools are appearing, such as Beyond 20/20, SuperCross, PC-Axis. These are generally better than the OLAP products for statistical issues, but could still make more use of structure. This is an important market sector, with big investment by database developers, so we should expect further development, and might be able to influence it. Statistical users are a small, but significant community. We should stress the need for good underlying structure and functionality.
Rafanelli M and Shoshani A (1990). STORM: A Statistical Object Representational Model. In Michalewicz Z, Statistical and Scientific Database Management, Springer-Verlag (1990), ISBN 3-540-52342-1.
Lenz H-J and Shoshani A (1997), Summarazability in OLAP and Statistical Databases. In Hansen D and Ionnidis Y, Proceedings of 9th SSDBM, IEEE Computer Society (1997), ISBN 0-8186-7952-2.
Page last updated 08 October 2003.